General Health System Overview
This section of the bioresonance report provides a broad overview of the body’s major physiological systems and their current energetic condition. By analysing energetic responses associated with different organs and functional systems, the report offers an indication of how balanced each system may be operating.
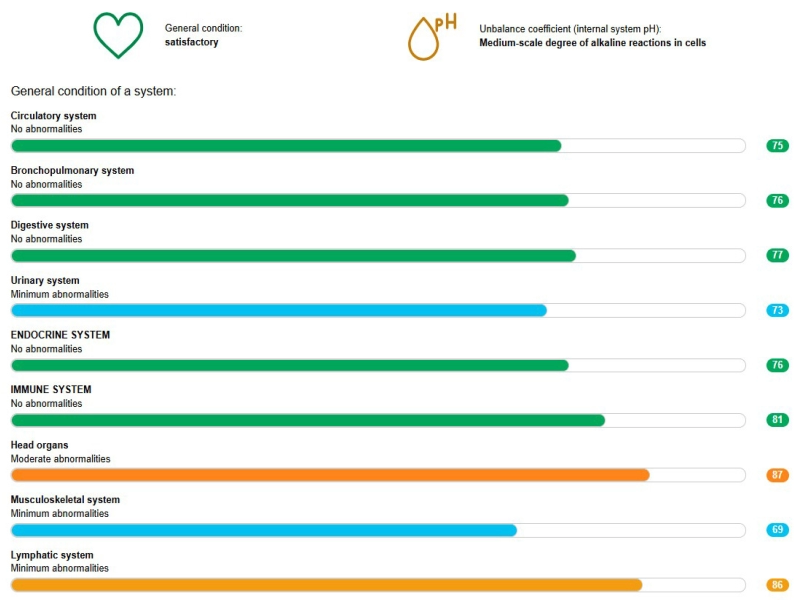
The summary at the top of the report provides a general health indicator along with an internal pH balance assessment. These indicators reflect overall energetic stability within the body’s internal environment. In this example, the general condition is assessed as satisfactory, suggesting that the body’s systems are functioning within an acceptable range of balance.
Below this summary, the report presents a series of key bodily systems, each represented by a horizontal bar indicating its current energetic status. These systems include the circulatory, bronchopulmonary, digestive, urinary, endocrine, immune, musculoskeletal, lymphatic, and head organ systems. Each bar reflects the level of energetic balance associated with that particular system.
The colour-coded scale provides a quick visual reference. Green indicators generally suggest that the system is operating within a stable and balanced range. Blue indicators may highlight areas where minor variations are present, while orange indicators can point to systems that may require closer attention or further investigation within a holistic assessment.
Alongside each system is a numerical value representing the measured energetic response. These values help practitioners identify relative strengths and potential imbalances between different systems in the body.
By reviewing these indicators together, bioresonance practitioners can gain a clearer understanding of how different systems may be interacting and where supportive approaches may help promote improved balance and overall wellbeing. This overview forms an important starting point for interpreting the broader bioresonance report.
Organ and Functional System Analysis
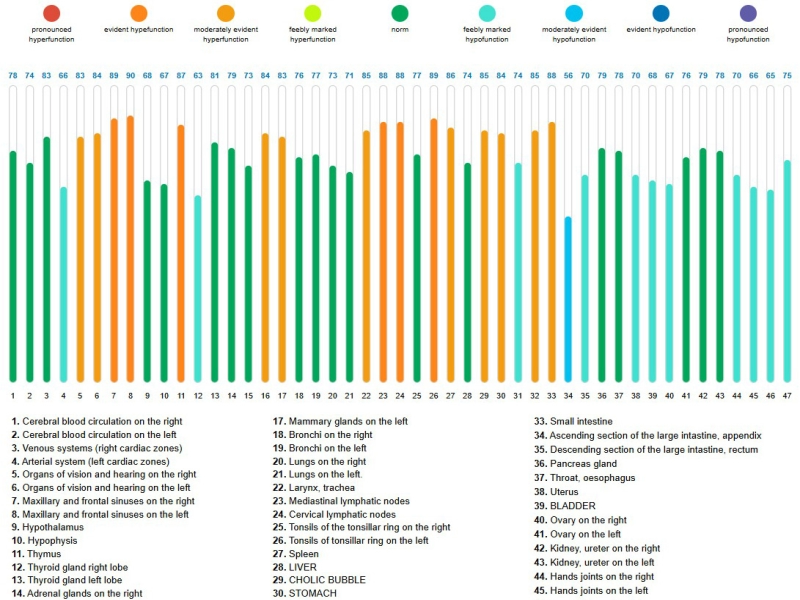
This section of the bioresonance report provides a more detailed analysis of specific organs and functional systems within the body. Each vertical indicator represents the energetic response associated with a particular organ or physiological structure, allowing practitioners to observe patterns across a wide range of bodily systems.
The chart displays a series of colour-coded bars, each corresponding to a numbered item listed below the diagram. These numbers relate to specific organs or functional areas such as the brain, circulatory system, respiratory organs, digestive organs, endocrine glands, lymphatic structures, and reproductive organs. By mapping these responses across multiple systems, the report provides a broader view of how the body’s energetic balance is distributed.
The colour scale at the top of the chart provides guidance on interpreting the results. Green indicators generally suggest that the energetic response associated with that organ or system is within a balanced range. Shades of yellow or orange may indicate areas where activity appears elevated or more reactive, while blue tones may highlight areas where energetic activity appears lower than expected. These variations can help identify patterns that may be relevant within a holistic health assessment.
The numerical values shown above each indicator represent the relative energetic measurement recorded during the scan. These values allow practitioners to compare responses between different organs and systems, helping to identify areas that may require further attention or support.
Because the body’s systems function together as an integrated network, this chart is not intended to isolate individual organs in isolation but rather to provide a broader overview of energetic relationships across the body. When interpreted alongside the other sections of the bioresonance report, this information can help practitioners develop a more comprehensive understanding of the body’s overall energetic balance and potential areas of focus for supportive therapies.
Spinal Health and Vertebral Analysis
This section of the bioresonance report provides an overview of the energetic condition of the spine and its associated vertebrae. The spine plays a central role in supporting the body, protecting the spinal cord, and acting as a communication pathway between the brain and the rest of the body. Because of this, imbalances in the spinal region can influence a wide range of physical systems.
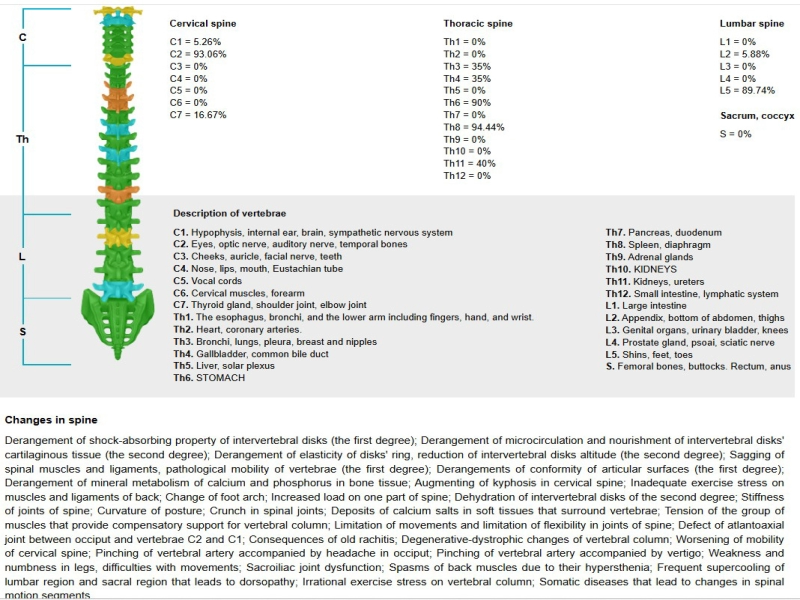
The diagram illustrates the different regions of the spine, including the cervical (neck), thoracic (mid-back), lumbar (lower back), and sacral areas. Each vertebra is represented individually and is associated with specific organs, glands, or physiological systems within the body. By analysing the energetic response linked to each vertebral level, the system provides insight into areas where tension, imbalance, or increased activity may be present.
The percentage values displayed alongside each vertebra represent the relative energetic activity detected during the scan. These values help indicate whether the energetic response associated with a particular spinal segment appears balanced or whether it may warrant further attention. Variations between segments can sometimes reflect areas where the body may be experiencing stress, strain, or compensatory patterns.
Below the diagram, the report provides a reference guide showing how each vertebra corresponds with specific organs and body functions. For example, certain cervical vertebrae relate to structures in the head and neck, while thoracic vertebrae are linked with organs such as the lungs, heart, stomach, and liver. The lumbar region is associated with organs in the lower abdomen, urinary system, and lower limbs.
The accompanying commentary section outlines possible patterns that may be observed in the spine, such as reduced disc flexibility, muscular tension, postural changes, or stress affecting the surrounding tissues. These observations help practitioners interpret how structural or energetic patterns in the spine may influence overall wellbeing.
Within a bioresonance assessment, spinal analysis is considered alongside other measurements in the report. When viewed together, these sections can provide a broader picture of how the body’s energetic systems interact, helping guide supportive therapies aimed at improving balance, mobility, and overall functional harmony within the body.
Microbial and Environmental Stress Indicators
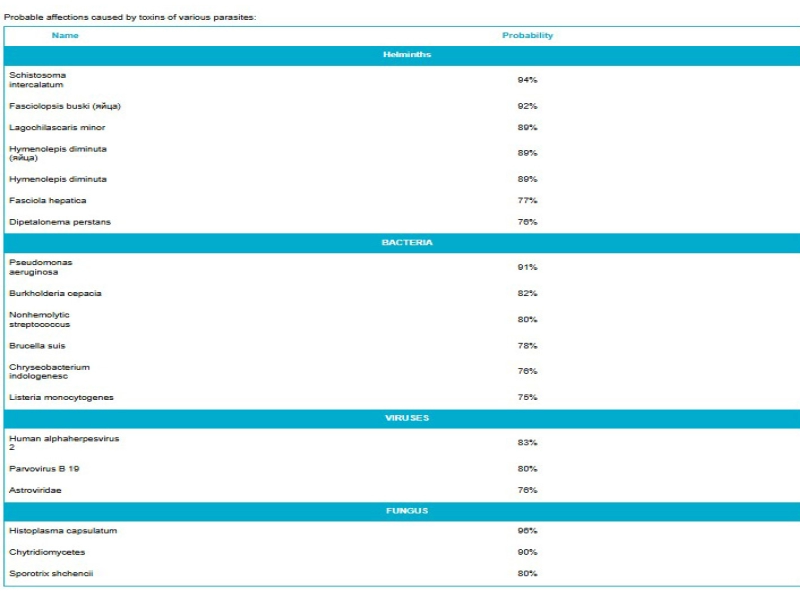
This section of the bioresonance report provides an overview of energetic responses that may be associated with microbial or environmental stress factors within the body. The analysis compares energetic signatures against a wide range of biological patterns linked to parasites, bacteria, viruses, and fungal organisms.
The table groups these findings into several categories, including helminths (parasitic organisms), bacteria, viruses, and fungi. Each entry represents a frequency pattern that the system has compared with the body’s energetic response during the scan. The percentage value shown alongside each item represents the degree of energetic resonance detected in relation to that particular pattern.
It is important to understand that these results do not represent a medical diagnosis or confirmation of infection. Instead, they provide an indication of energetic similarities that may suggest areas where the body could be experiencing stress or where the immune system may be responding to environmental influences.
Higher percentage values may indicate stronger energetic correspondence with a particular pattern, while lower values may reflect weaker associations. Practitioners typically review these results alongside other sections of the report, such as organ balance, immune function, and overall energy levels, in order to build a broader picture of the body’s energetic condition.
In holistic health approaches, this type of analysis may be used to guide further investigation into lifestyle, environmental exposure, nutritional balance, or supportive therapies aimed at strengthening the body’s natural resilience.
By viewing these indicators as part of the overall energetic assessment, practitioners can consider whether additional support may be beneficial in maintaining balance within the body’s internal systems.
Vitamin and Nutritional Balance Assessment
This section of the bioresonance report reviews the body’s energetic response in relation to key vitamins and micronutrients. Vitamins play an essential role in supporting many biological processes, including energy production, immune function, nervous system health, tissue repair, and metabolic regulation.
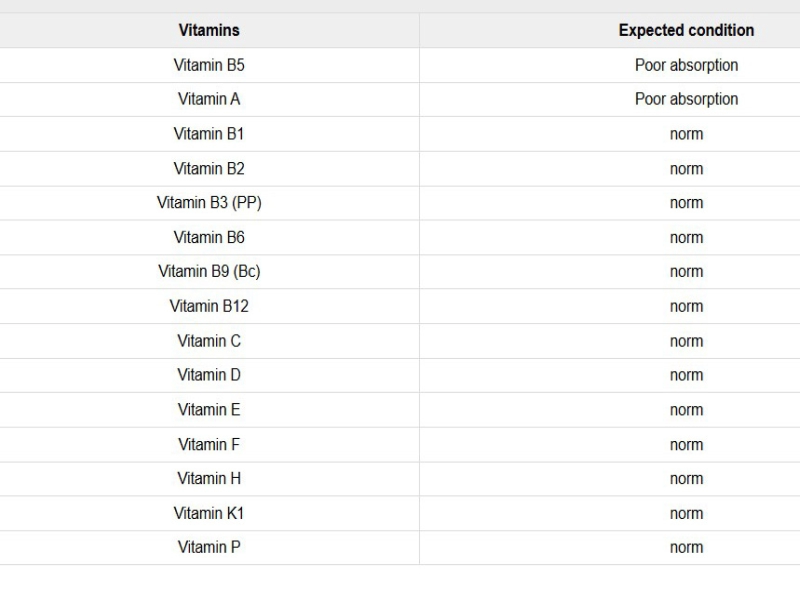
The table lists a range of important vitamins, including several B vitamins, as well as vitamins A, C, D, E, K, and others that contribute to maintaining normal physiological function. The “expected condition” column reflects how the body’s energetic patterns correspond with each vitamin at the time of the scan.
In many cases, the report may indicate that the energetic response associated with a particular vitamin appears within a normal range. This suggests that the body’s current energetic patterns do not indicate significant imbalance related to that nutrient.
In some cases, the report may highlight patterns associated with reduced absorption or utilisation. This does not necessarily indicate a deficiency, but it may suggest that the body’s energetic response linked to that nutrient is lower than expected or that absorption processes may not be functioning at optimal levels.
Such patterns can sometimes be influenced by factors such as digestion, stress, lifestyle habits, dietary intake, or the body’s current metabolic demands. For this reason, these findings are typically considered alongside other sections of the bioresonance report to build a broader understanding of the body’s overall energetic balance.
From a holistic perspective, this information can help guide discussions around nutrition, lifestyle adjustments, and supportive approaches aimed at maintaining healthy vitamin balance and supporting the body’s natural regulatory processes.